There are a lot of numbers on the web.
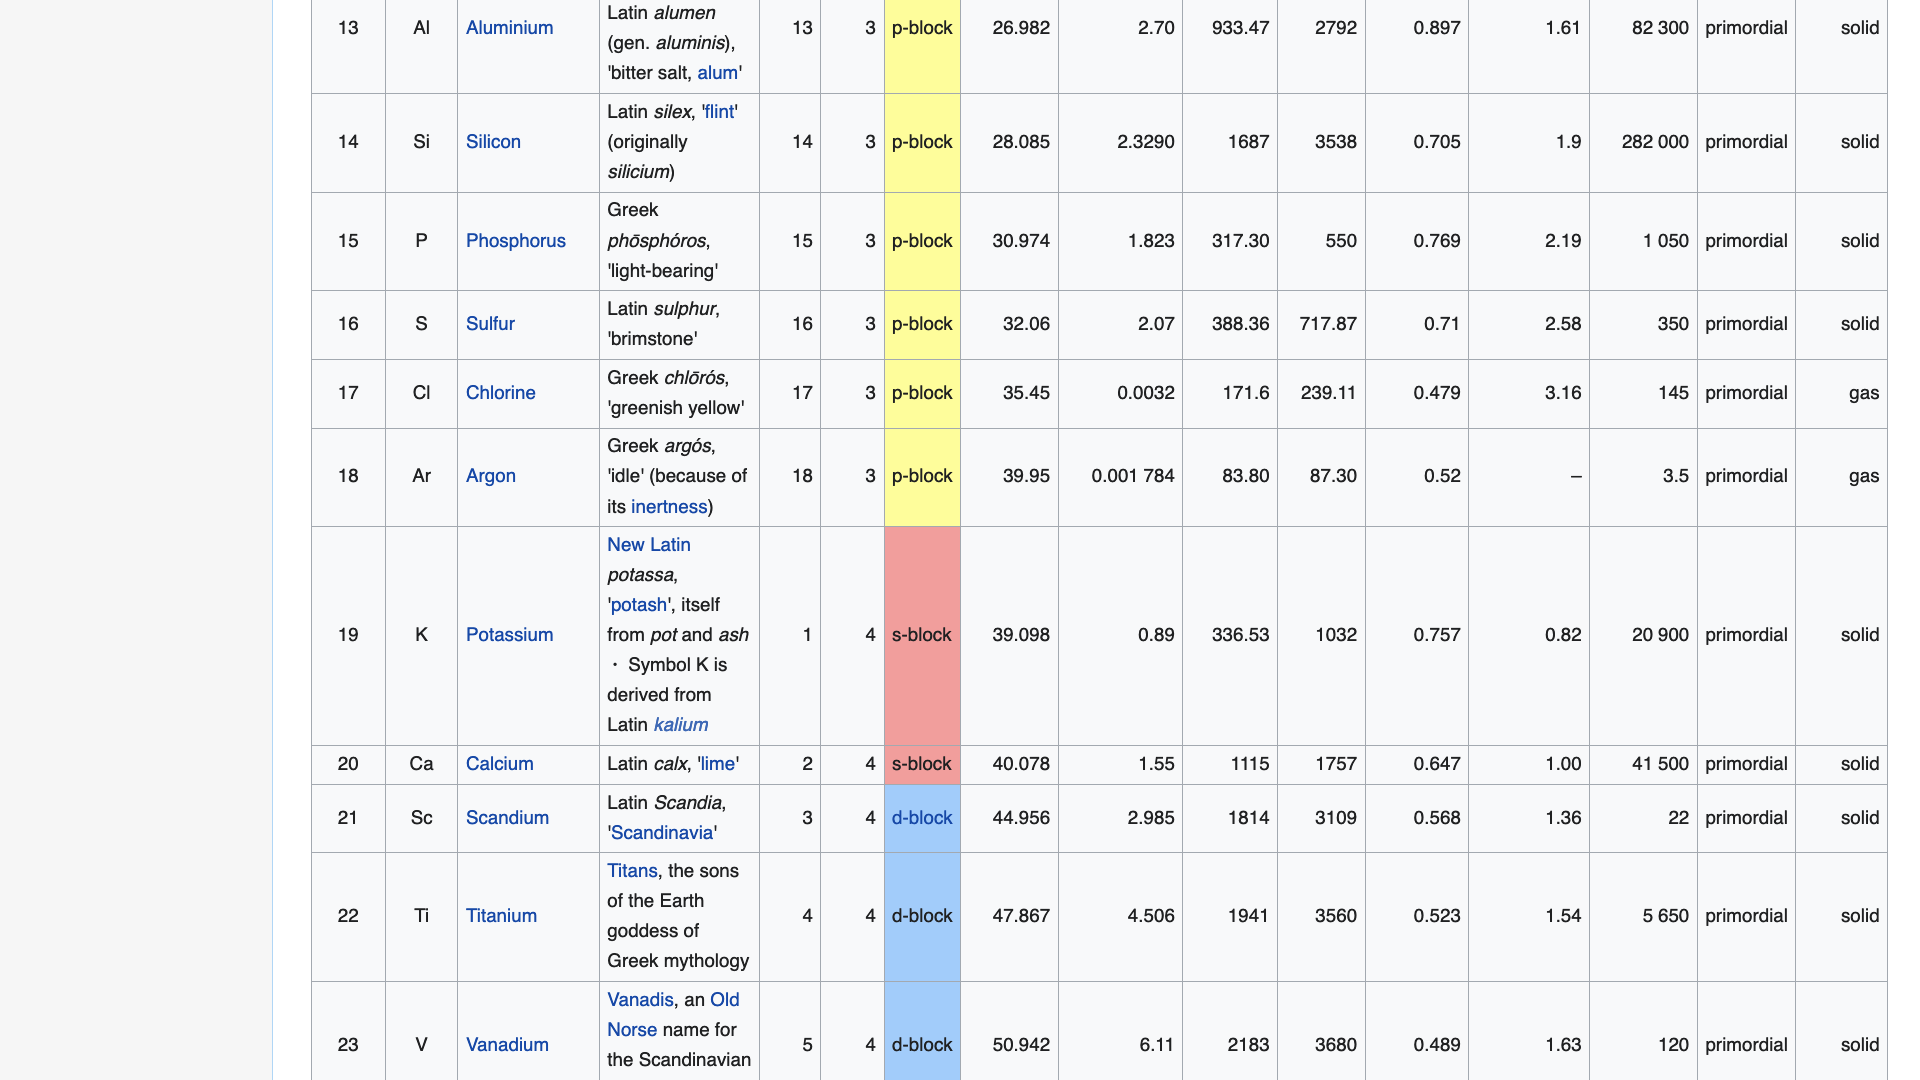
Here are some numbers about atoms from Wikipedia’s list of chemical elements:
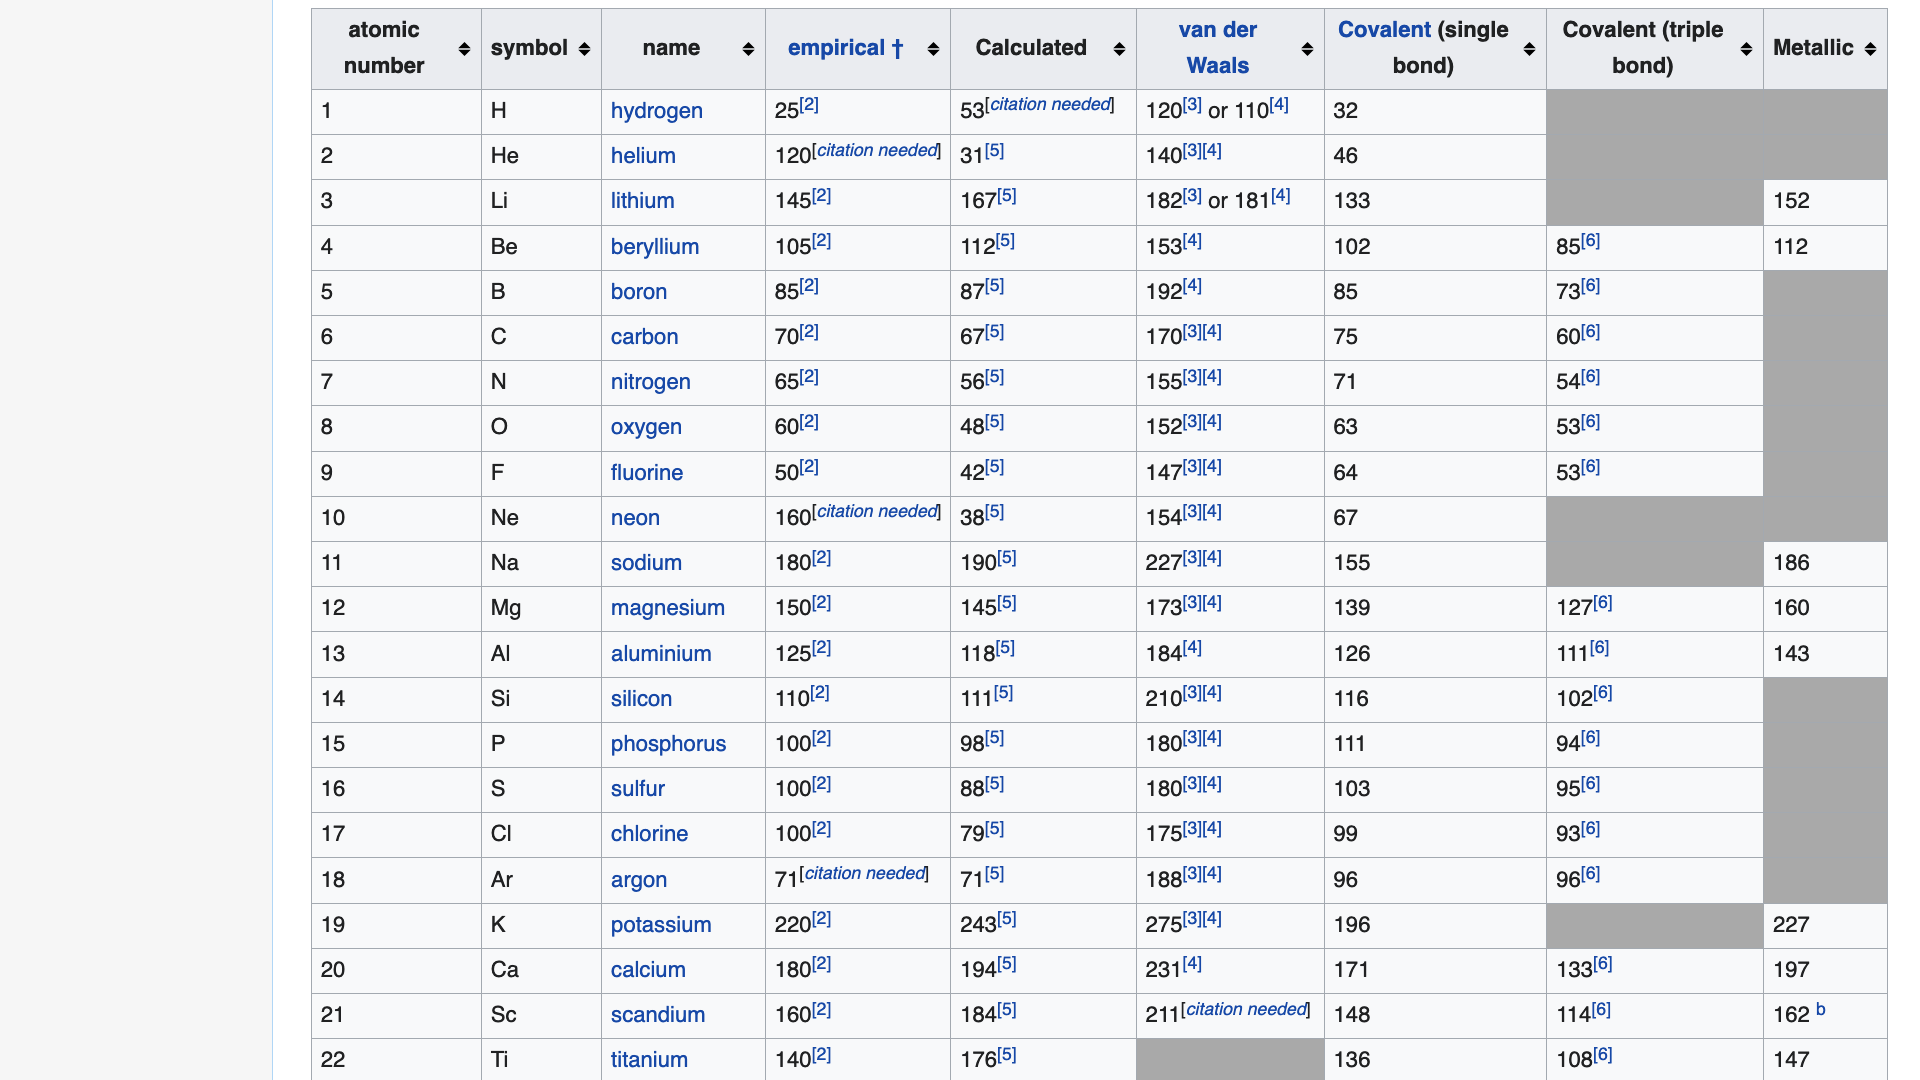
And some more numbers about the sizes of atoms from Wikipedia’s atomic radii data page:
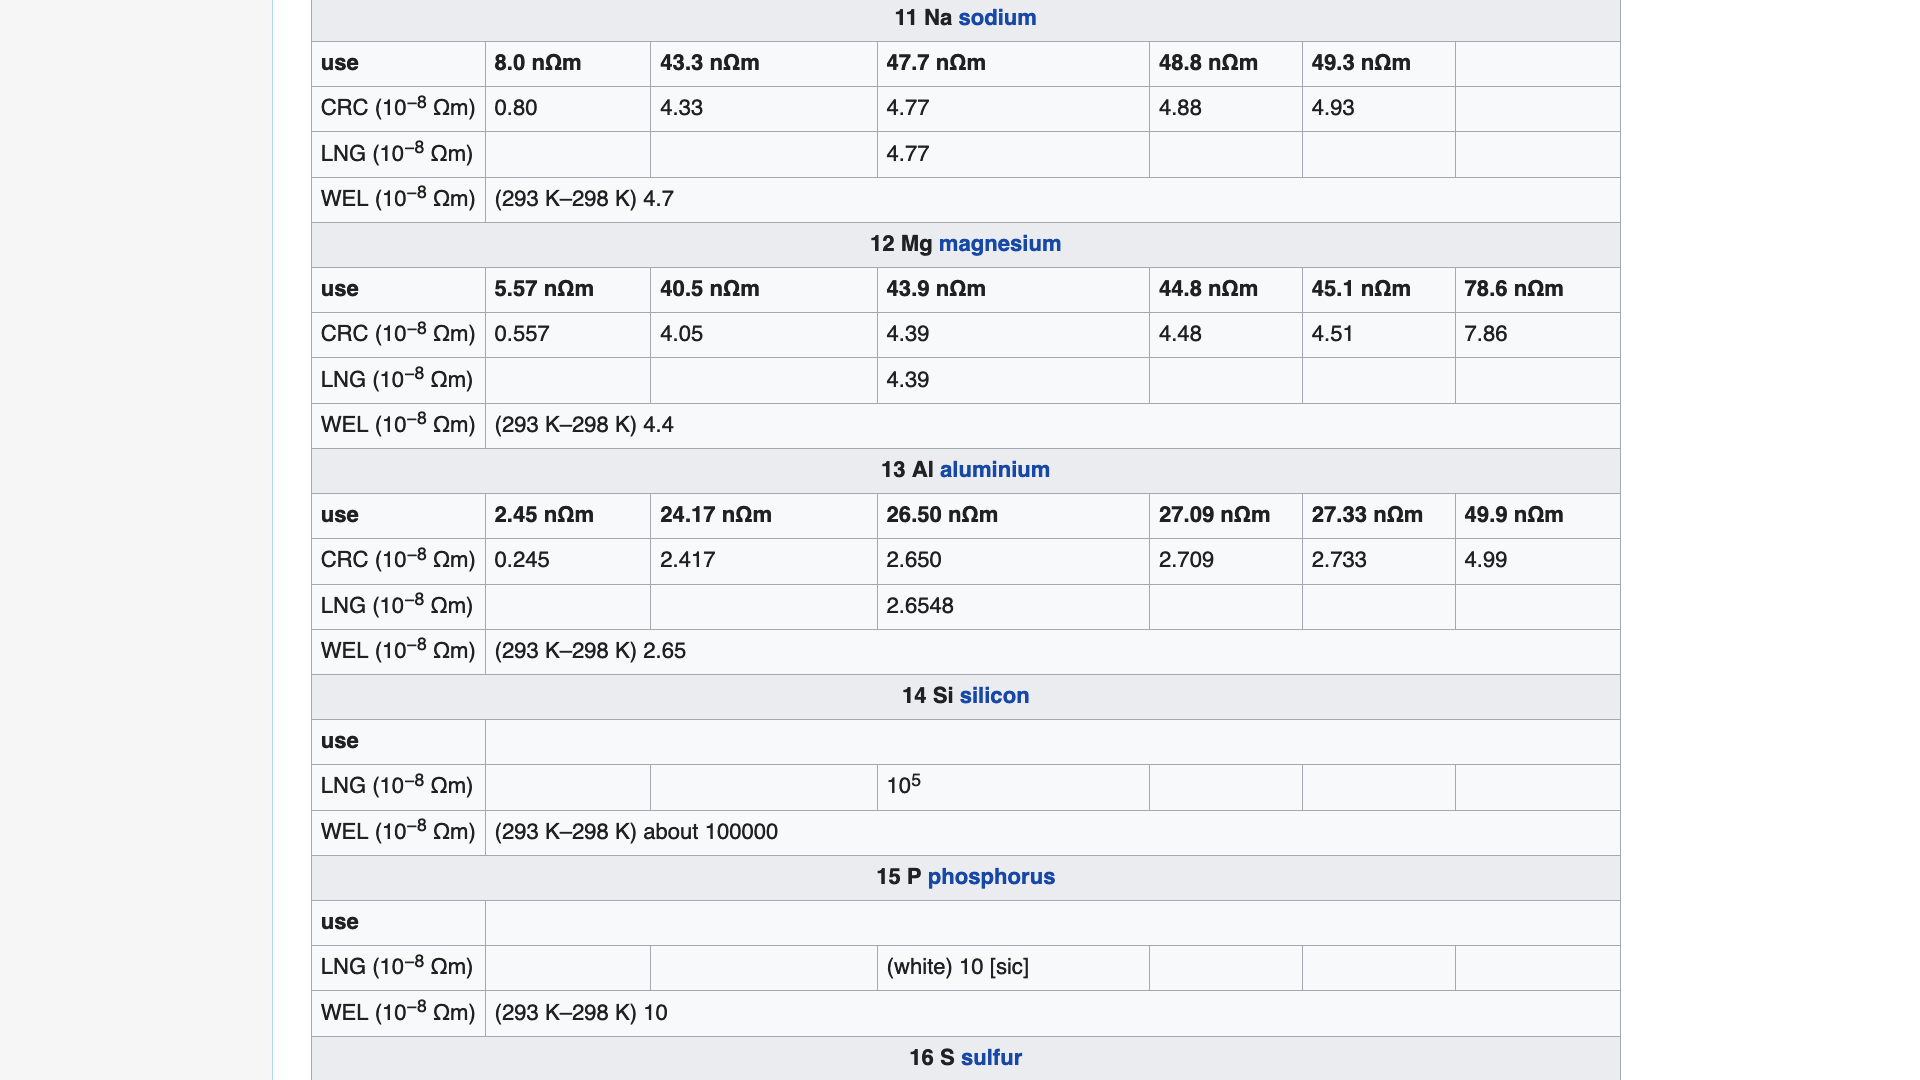
Let’s not forget the electrical resistivities of atoms from Wikipedia’s electrical resistivities data page:
Or the thermal conductivities of atoms from Wikipedia’s thermal conductivities data page:
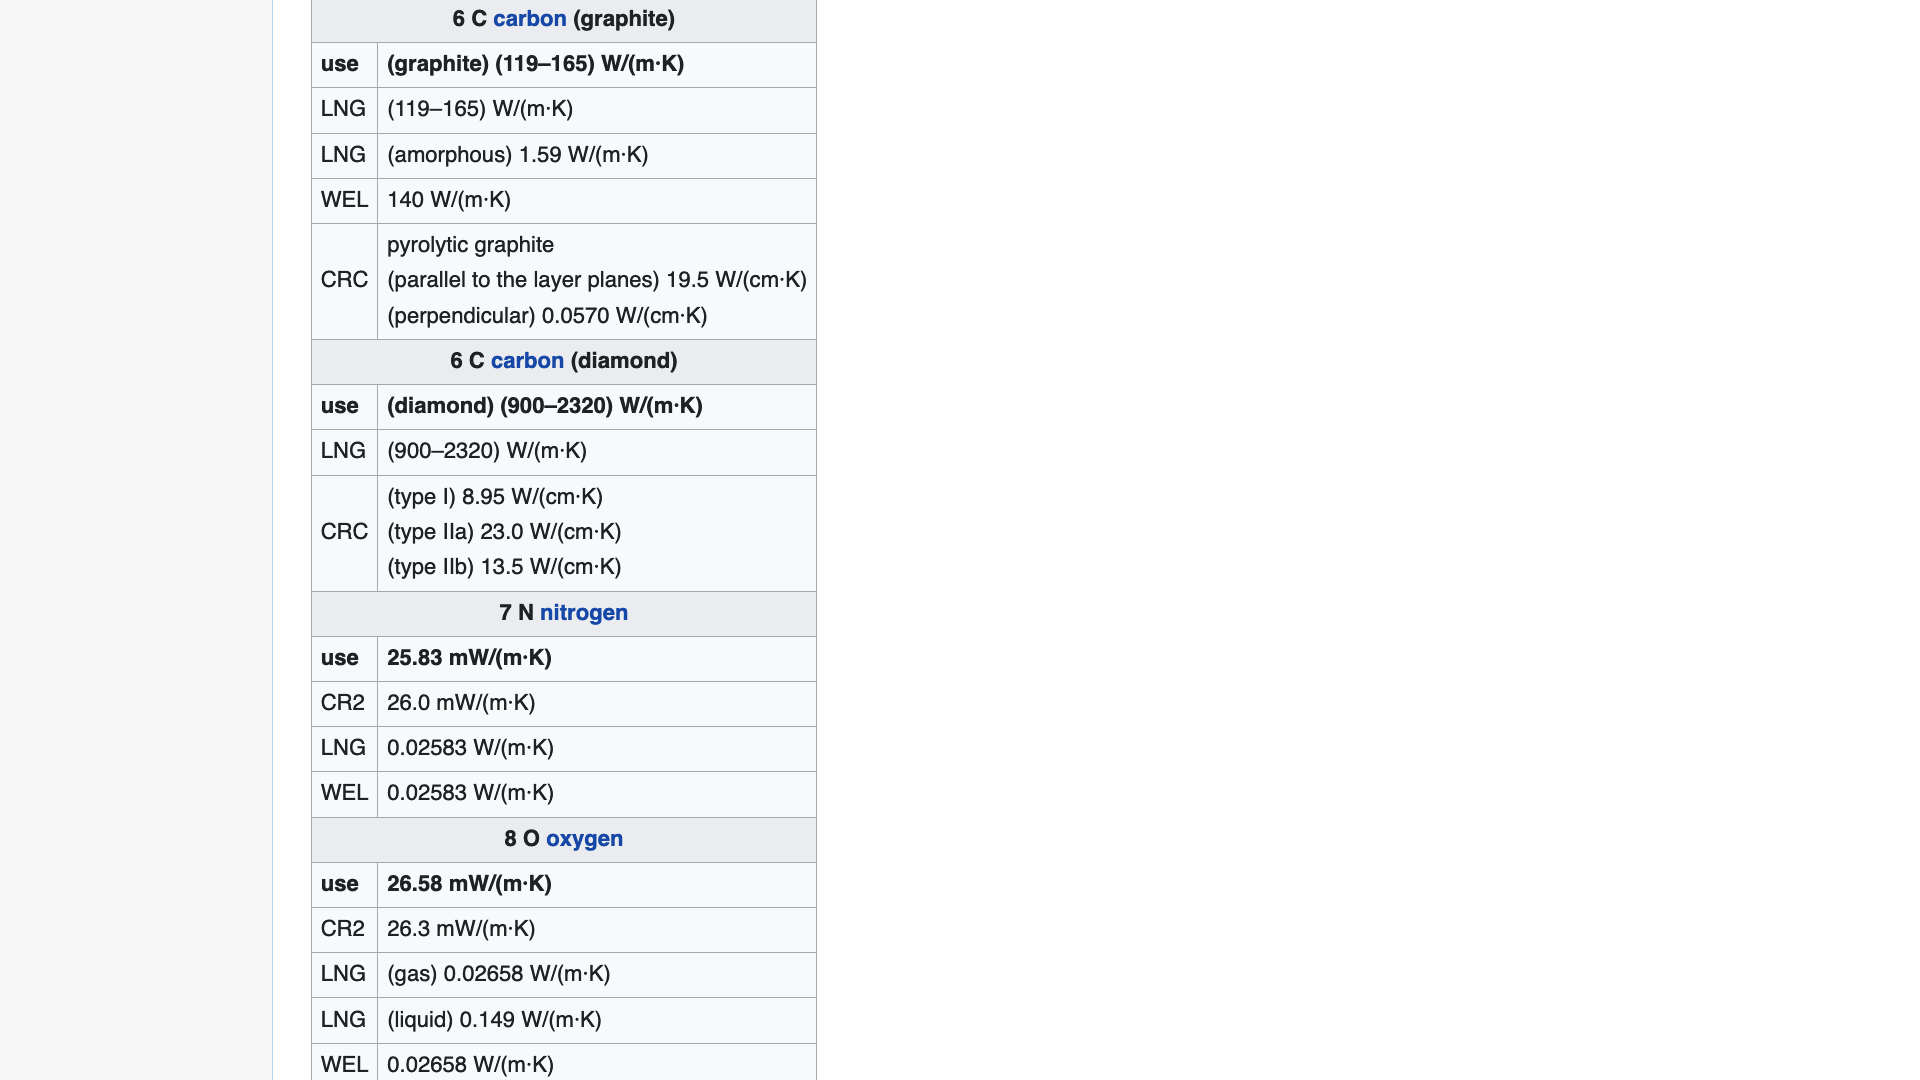
I could go on, but you get the picture: there are a lot of numbers on the web.
“You get the picture” is an unfortunate turn of phrase. Actually, you don’t get the picture. That’s the whole problem. All you get is column after column and row after row of numbers.
If only there were a way to visualize all those values.
Today, following on from my recent article, A visualization from the Open Web Mind, I’m going to talk about how the Open Web Mind might make sense of all the numbers on the web.
Beyond the periodic table
Let’s start with a visualization of Wikipedia’s numbers about atoms that I posted on things made thinkable a few years ago:
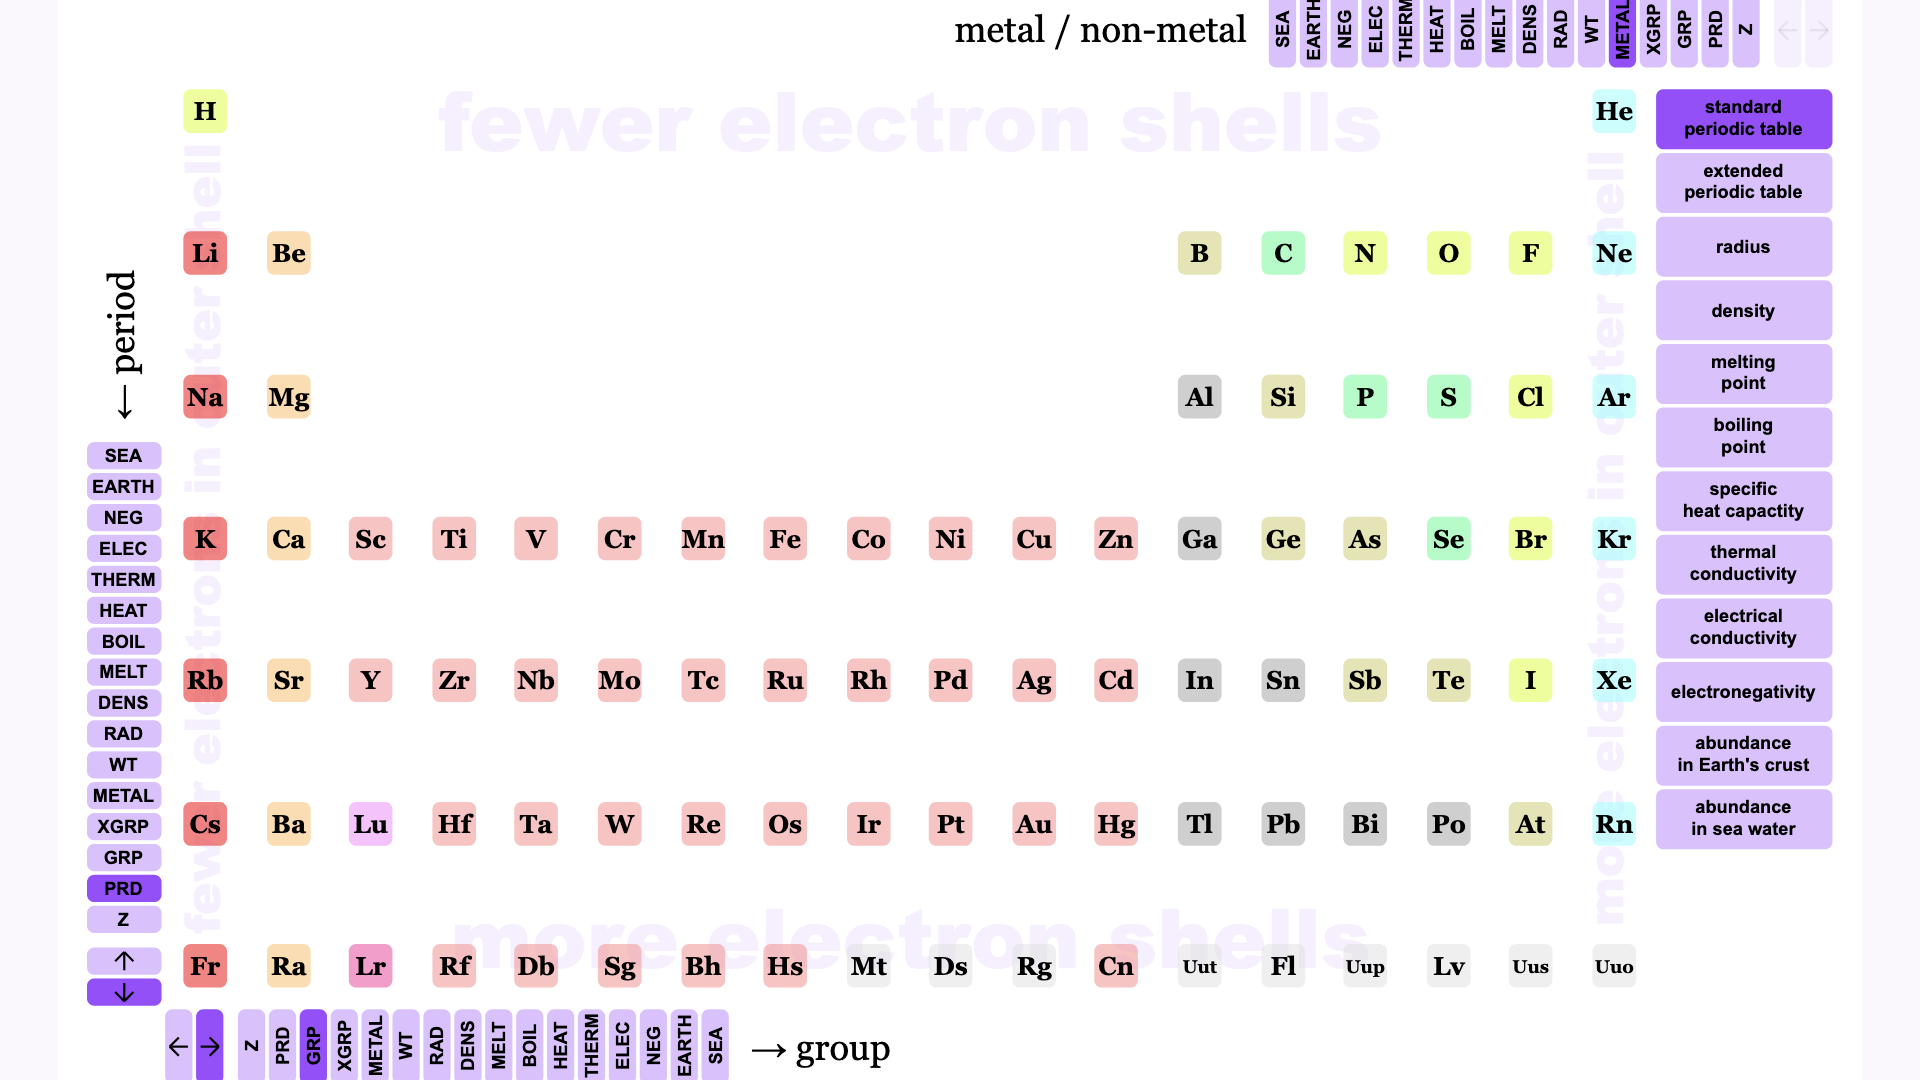
You probably recognize this layout of the elements: it’s the periodic table. It was revolutionary when it was introduced by Dmitri Mendeleev in 1869. Not so revolutionary when I published it in 2013.
Here’s the thing though: all it is is a scatter plot of numbers about atoms.
Elements with fewer electron shells are at the top: hydrogen atoms have only 1 electron shell, lithium atoms have 2, sodium atoms have 3, and so on down to francium atoms with 7 electron shells.
Elements with fewer electrons in their outer shell are shown to the left: sodium atoms have only 1 electron in their outer shell, silicon atoms have 4, argon atoms have 8.
Those aren’t the only numbers we have for atoms, though. We have all those other numbers from Wikipedia.
And if we can plot numbers of shells against numbers of electrons to give the periodic table, we can plot any number against any other number to give many other charts.
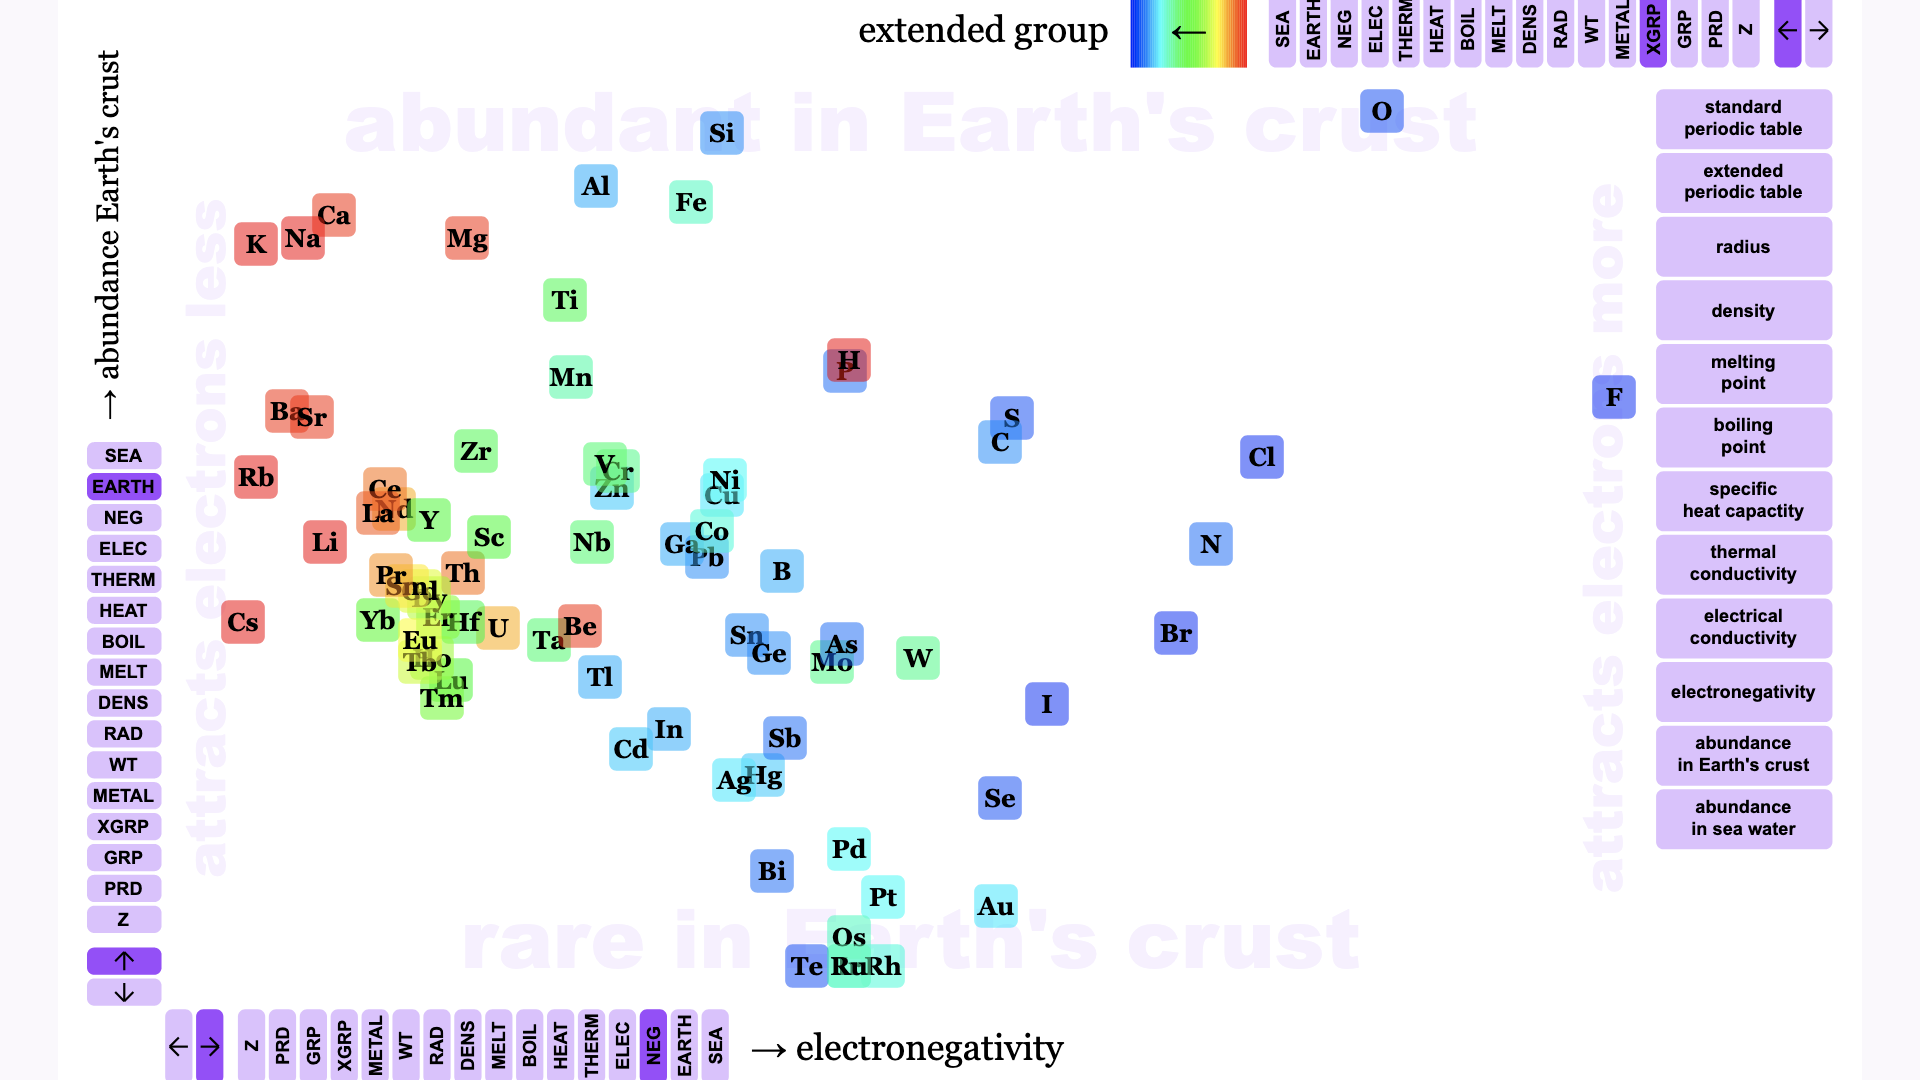
For example, we can plot the density of an element against the number of protons in the nucleus of an atom of that element:
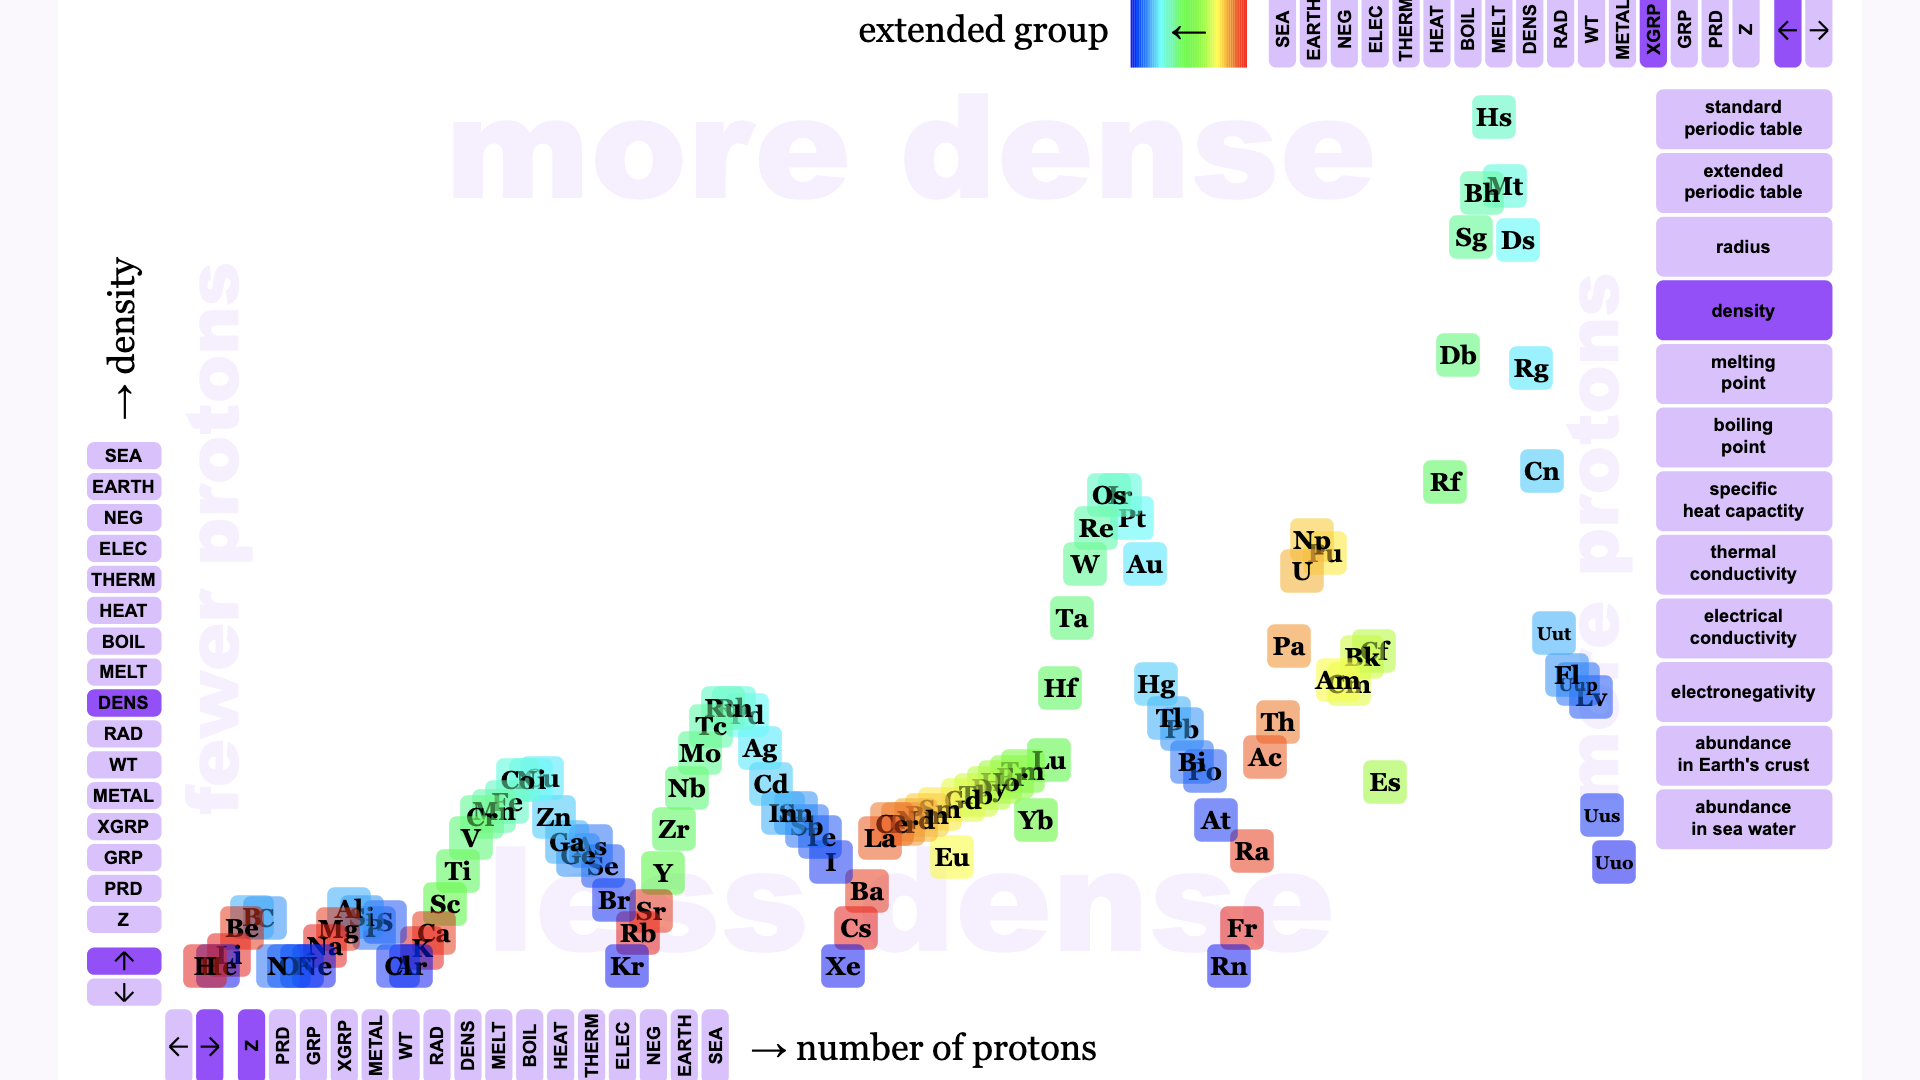
If you’re a physicist or a chemist, you’ll recognize this plot and understand the significance of its peaks and valleys. If not, don’t worry. The point here is not to explain physics or chemistry, but to recognize that hidden in all those numbers on Wikipedia are patterns that are revealed only when we visualize the data, patterns that represent important insights.
There are plenty of other insights hiding in the numbers. Here are some that I’ve pre-programmed:
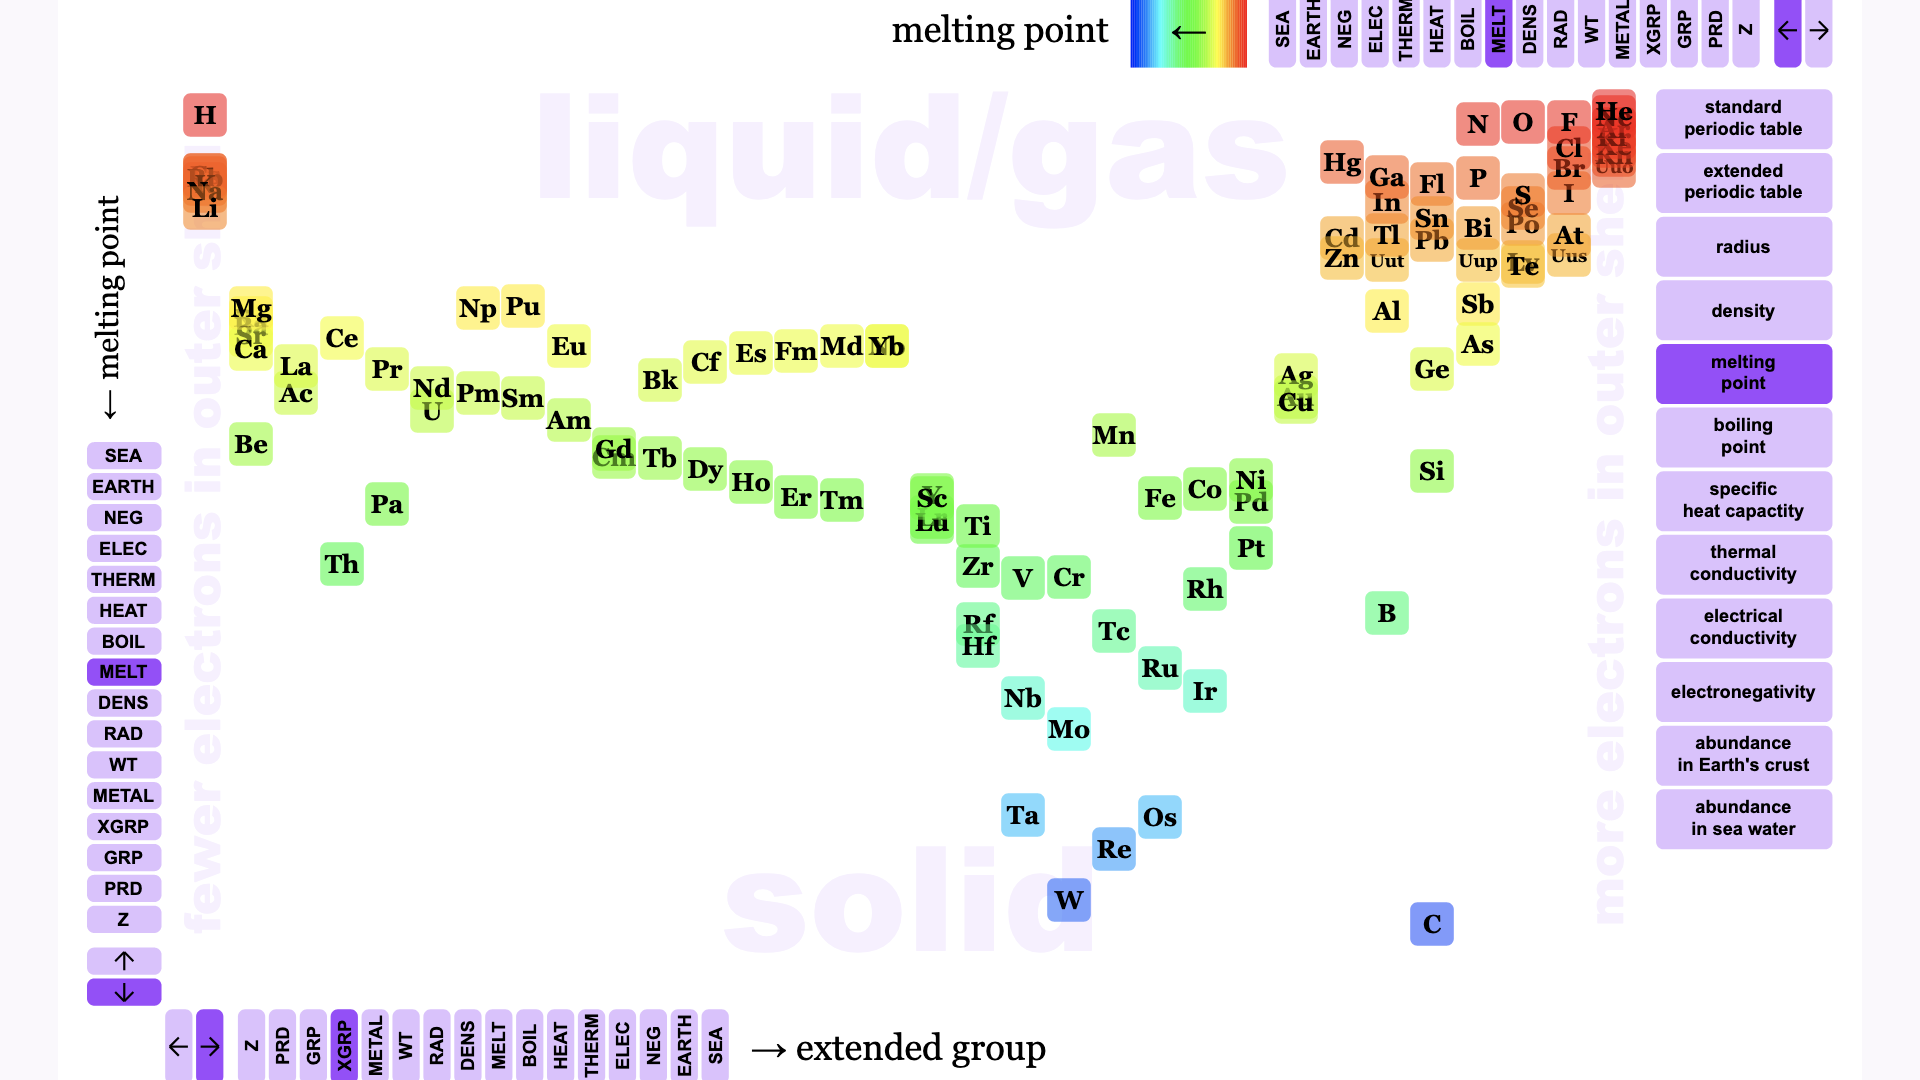
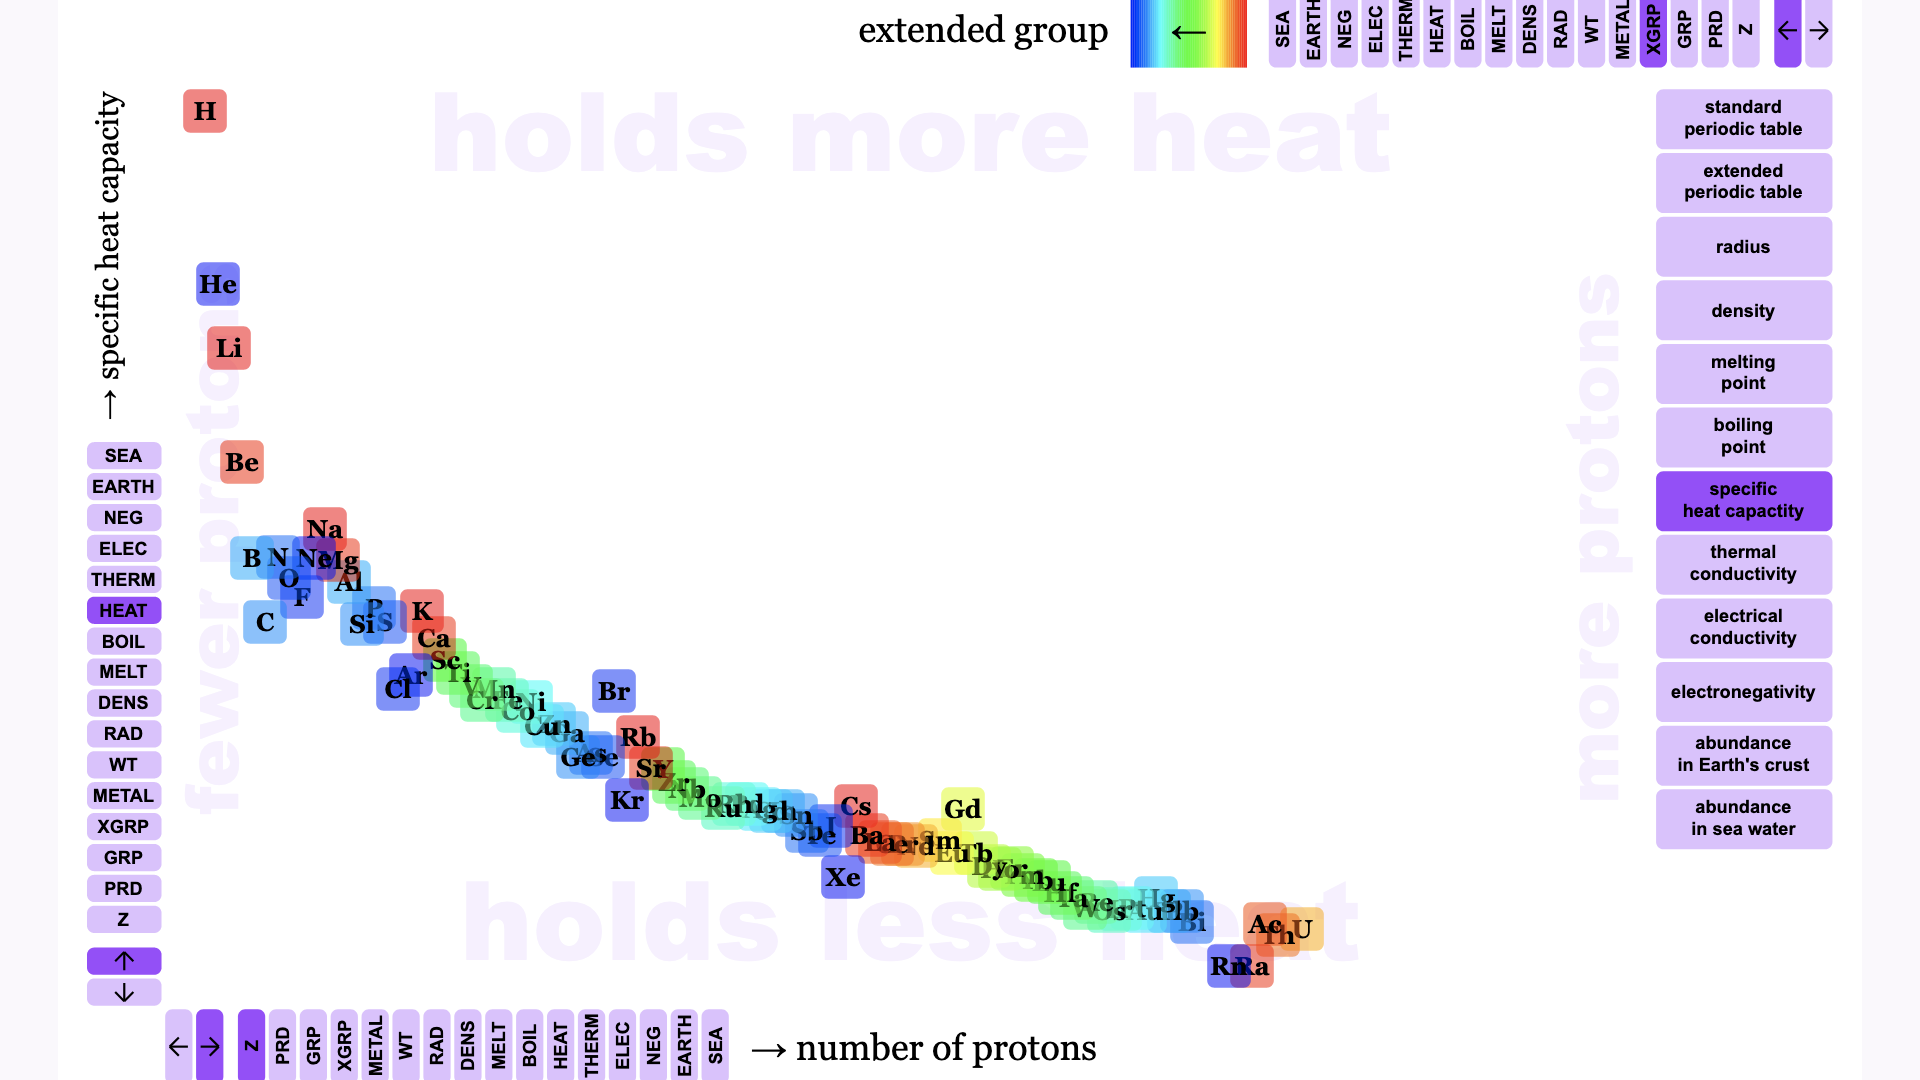
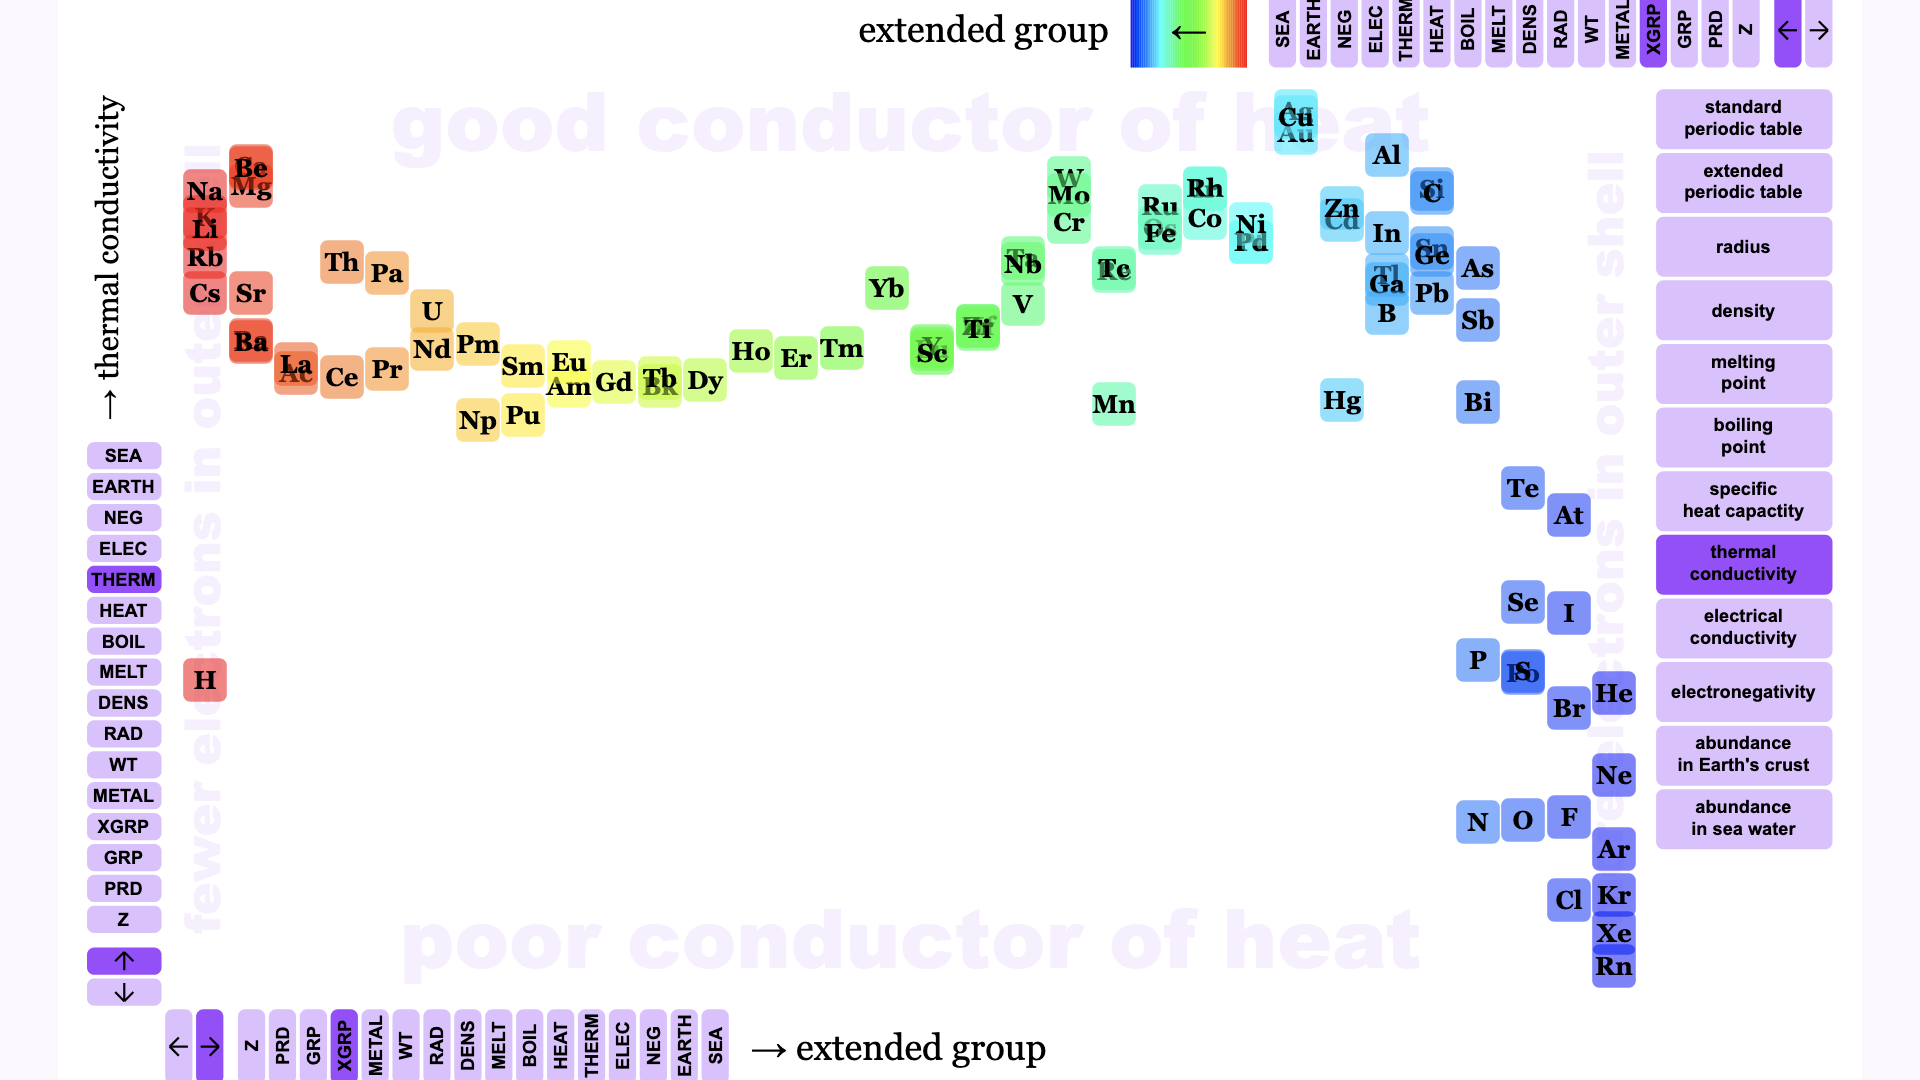
You can find more by using the controls to plot any number about atoms against any other number about atoms:
Beyond the planets
The trouble with my visualization of atoms is that it took me a long time to create it.
With the Open Web Mind, it won’t take so long.
Here are some numbers about planets from NASA:
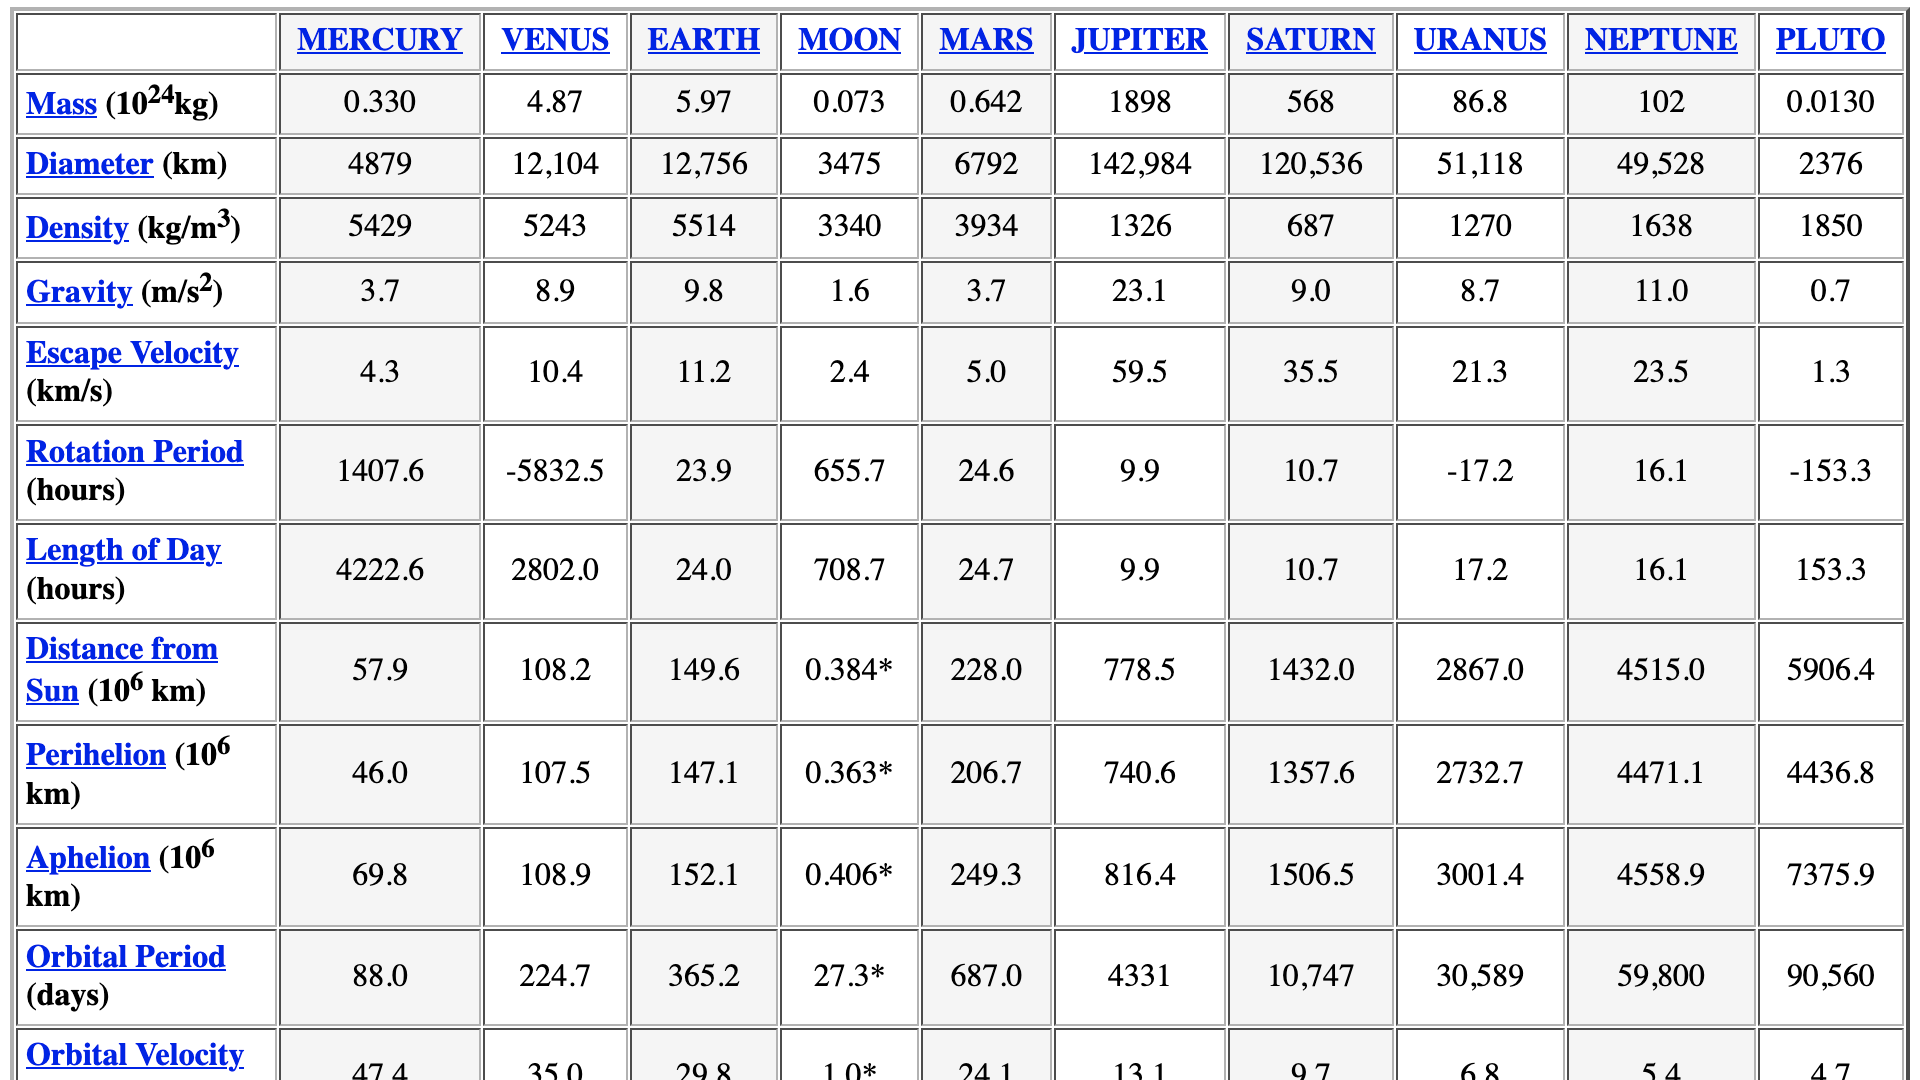
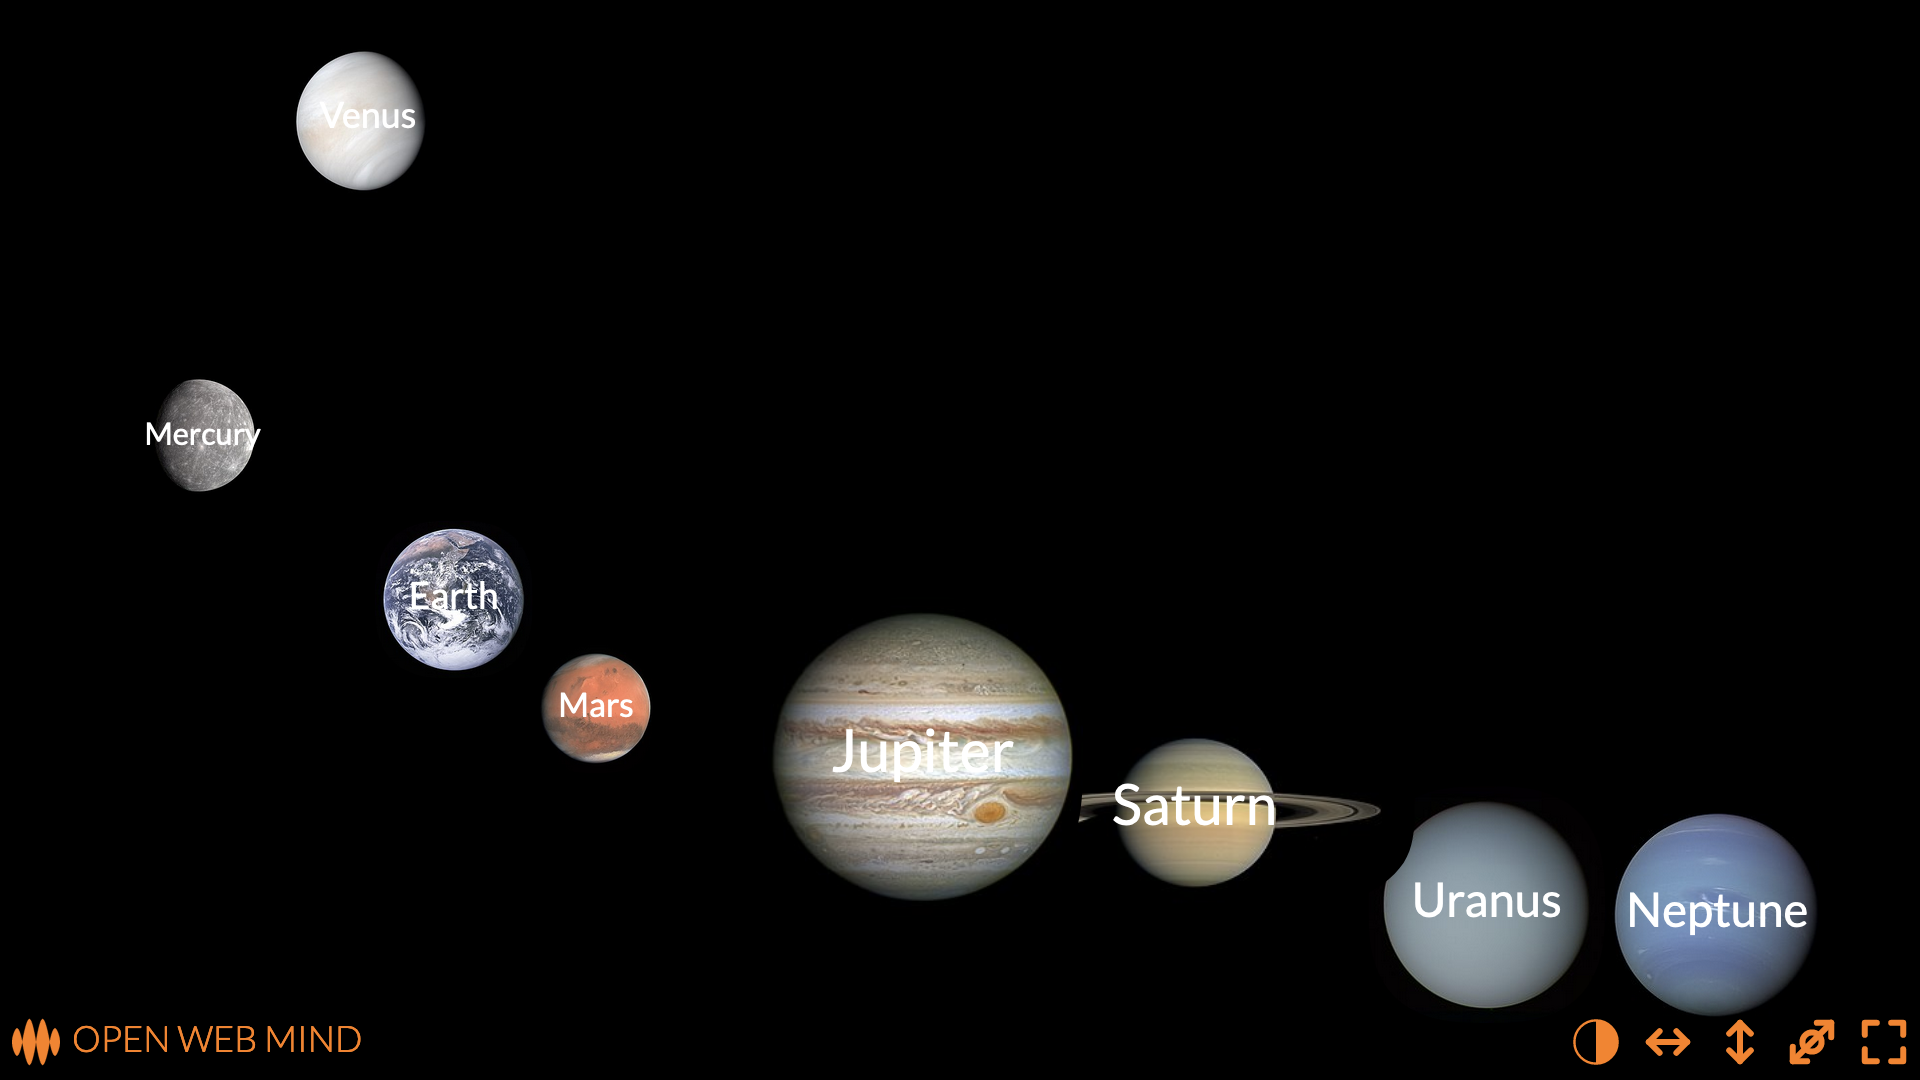
A few months back, I imprinted a mind with the data in this table, and created a visualization of NASA’s numbers about planets, which, again, I posted on things made thinkable:
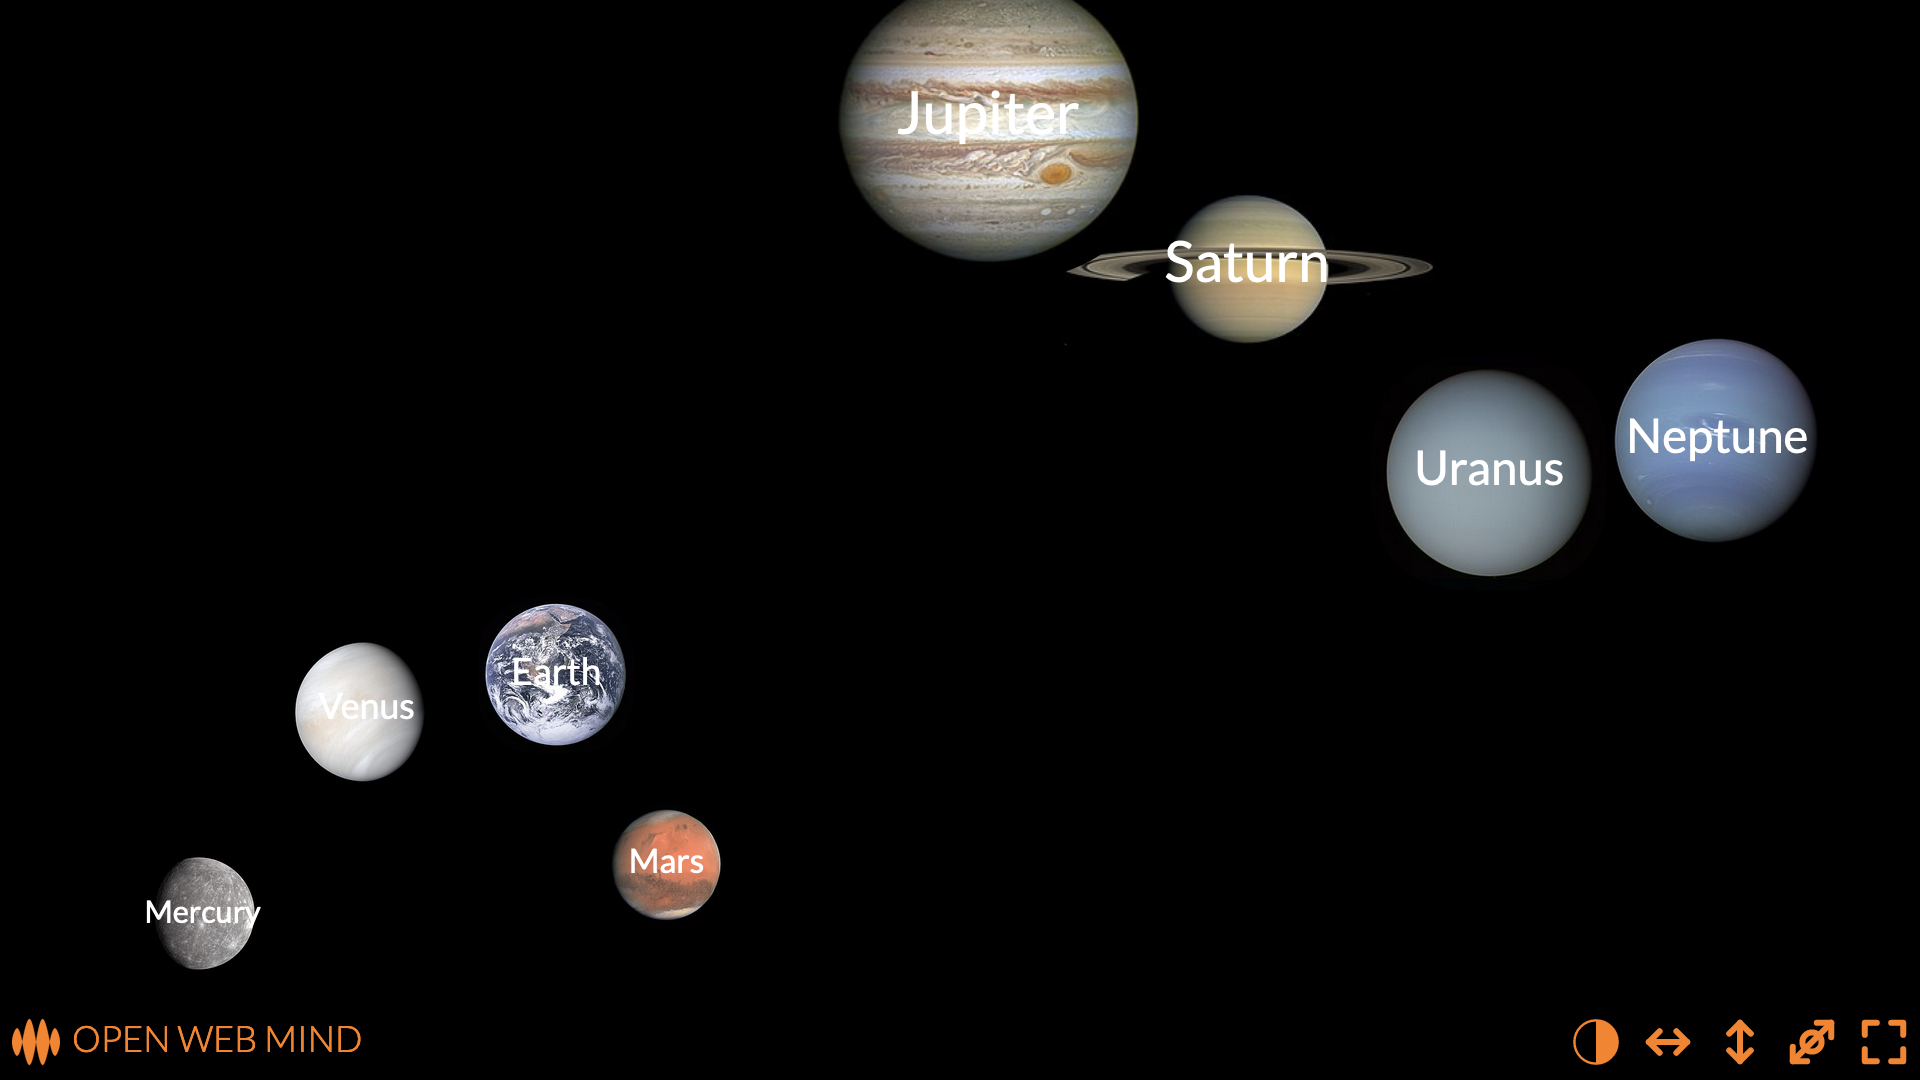
This plot of the mass of each planet against its distance from the Sun seems to me a far better way of making sense of all those numbers than just listing them in a table.
You can immediately see that Mercury is the closest planet to the Sun, the Earth is the third rock from the Sun, and Neptune is further out.
You can also see which are the bigger planets. The most massive planets – Jupiter and Saturn – are at the top, and the least massive – Mercury and Mars – are at the bottom.
The sizes of the images reflect the diameters of the planets: again, Jupiter and Saturn are the largest, Mercury and Mars the smallest.
But that’s just one way to visualize the planets. We can choose to plot any of the numbers about planets against any other numbers about planets.
For example, we can change the visualization to plot the mean temperature on the surface of each planet against its distance from the sun:
We can see that the temperature of a planet falls the further it is from the sun, as you’d expect. Mercury, close to the Sun, is pretty hot, at 167 degrees. Neptune, far from the Sun, is pretty cold, at -200 degrees.
But there’s an exception to this downward trend. Venus, at the top, is further from the Sun than Mercury, but it’s much hotter than Mercury, at 464 degrees.
The reason? The greenhouse effect. Venus has a thick carbon dioxide atmosphere, which traps the heat from the Sun, making it hotter than it otherwise would be.
That’s pretty cool, if you’ll forgive the reverse pun. By imprinting a mind with NASA’s numbers, we’ve been able to visualize the planets in a way that reveals this insight about Venus’s atmosphere.
There’s so much more I could mention about this visualization: for example, how the Open Web Mind automatically selected a linear scale for the mean temperature but a logarithmic scale for the distance from the sun; or how neither axis is strictly linear or logarithmic, instead, both axes are flexible, allowing the Open Web Mind to create a clearer visualization by shifting the planets so that they don’t overlap too much.
But I’m going to leave it at that for now.
Beyond numbers
Here’s the point.
Back in 2013, it took me many weeks to create that visualization of atoms.
Back in 2021, it took me many weeks to create the visualization of planets, too, but that’s because I was developing the Open Web Mind as I went along.
What I’m aiming at here is the ability to imprint a mind with any numbers, from any source on the web, and create a meaningful visualization of those numbers in an instant.
And not just numbers. I’ve focused on numbers for the first couple of visualizations from the Open Web Mind, because numbers are, well, they’re definite.
But if you think about the knowledge you’ve accumulated in your mind – the knowledge accumulated in any human mind – it’s mostly not numbers.
Most human knowledge is more nebulous than numbers.
It’s concepts.
And it’s connections between concepts.
That’s what I’m working on now, and what I’ll show you next: visualizations of concepts, and connections between concepts, in the Open Web Mind.
What I’m aiming at here is the ability to imprint a mind with any knowledge, from any source on the web, and create a meaningful visualization of that knowledge in an instant.
—
Content from Wikipedia reproduced under CC BY-SA 3.0
Content from NASA reproduced under US Government Works License